Ficus Sycamore
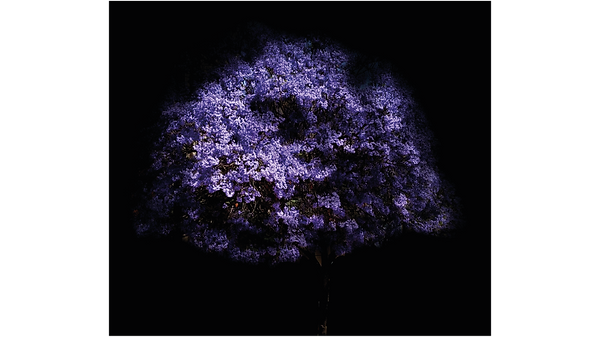
Sigalon Rose
Mimoza
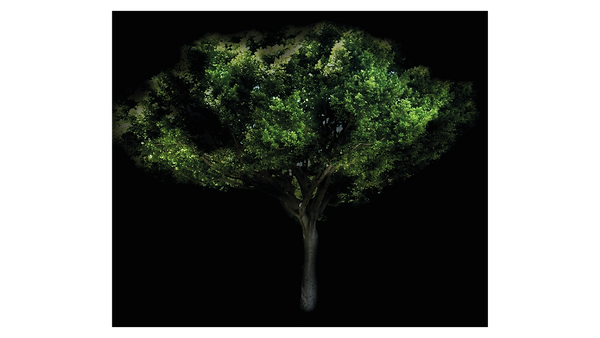
Ficus Avenues
Amount
9
4
2
Fruits
Fall
Average foliage area
Sqm. foliage
Concentration
Total
Yes
No
October / December
June / August (main)
October-April /
July-August
11 diameter
9 diameter
1089 sqm
1156 sqm
162 sqm
1,2,3,5
3,5
4,5
2407/5300 sqm
(45% of the avenue)
Yes
October / December
June / August (main)
11 diameter
Amount of shade for aclimate comfort
450sqm foliage in each area
(1060 sqm)
Total shade on the avenue
2250/5300 sqm
The layer of trees examines the effect of the trees foliage on the avenue.
Examine the classification of the types of trees, their height, seasons in which there is a fall, according to their varying concentration along the avenue.
Analysis type
Ficus Avenues
Quantity in the boulevard: 9
Average Hight: 12m
Average Folige: 11 Diameter
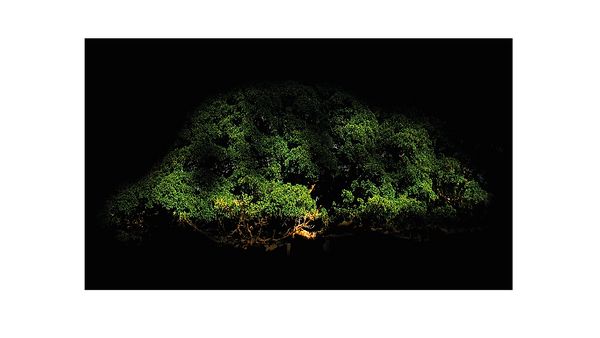
Ficus Sycamore
Quantity in the boulevard: 4 Average Hight: 11m
Average Folige: 17 Diameter
Sigalon Rose Mimoza
Quantity in the boulevard: 2 Average Hight: 13m
Average Folige: 9 Diameter
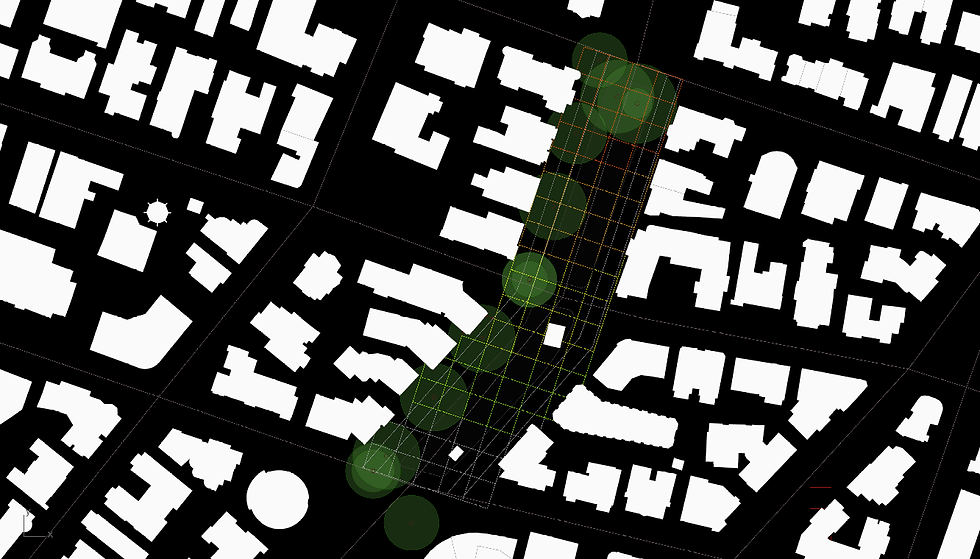
Foliage of the trees according to the map of the division of the areas in the boulevard. Thus the amount of foliage and their spatial impact in a given part can be estimated.
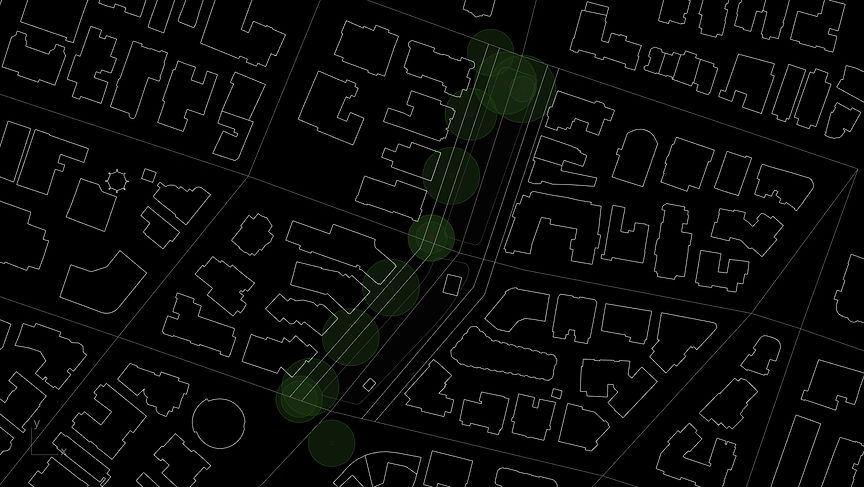
Forces exiting from the point of planting the tree and disperse according to its foliage determined by the size of the tree. An overlap can be seen between the forces in the areas where the foliage of the trees meet and thus a foliage space is created that can be classified to create a comfortable climate zone.