Electrical installations (ELF) in the spine, and amount of radiation emissions (non-ionizing radiation)
Communication facilities (RF) in the avenue, and the amount of radiation emission (non-ionizing radiation)
Examples
Power lines transformation stations household appliances
Mobile telephon
Cellular networks
Broadcasting facilities for television and radio
Percentage
2.38/10% ICNIRP
4.72/30% ICNIRP
Radiation-conducting materials and
amount of Radiation Emission (RF)
10% concrete
10% Glass with sun protection
100% unprotected glass
100% Gypsum
50% stone
80% Metals
70% wood
60% RF
Sun hours and amount of radiation (UV)
summer
05: 30- 18:20
1-11
Average radiation emission 89%
52% UV
winter
6: 30-16: 45
1-3
Average radiation emission 15%
Minimum amount of radiation (Average between the long and short day)
6 UV
38% Of all types of radiation and according to a graph of regional radiation
Maximum amount of radiation (Average between the long and short day)
8 UV
57% Of all types of radiation and according to a graph of regional radiation
Areas with low radiation (According to the regional radiation graph)
The western side of the areas
45%
Areas with high radiation (According to the regional radiation graph)
The eastern side of the areas
55%
Average amount of radiation for aclimate comfort
3.2 ICNIRP, 7UV- Radiation in all the areas
43% Radiation

The radiation layer examines the effect of radiation concentration in areas of the avenue.
The examination is performed by analyzing information according to global and national standards in combination with radiation scatter graph. Thus it is possible to estimate areas where the radiation concentration is higher / lower than the standard.
Radiation amount
Map of the distribution of radiation in space according to levels (see Bible of colors)
kWh/m2
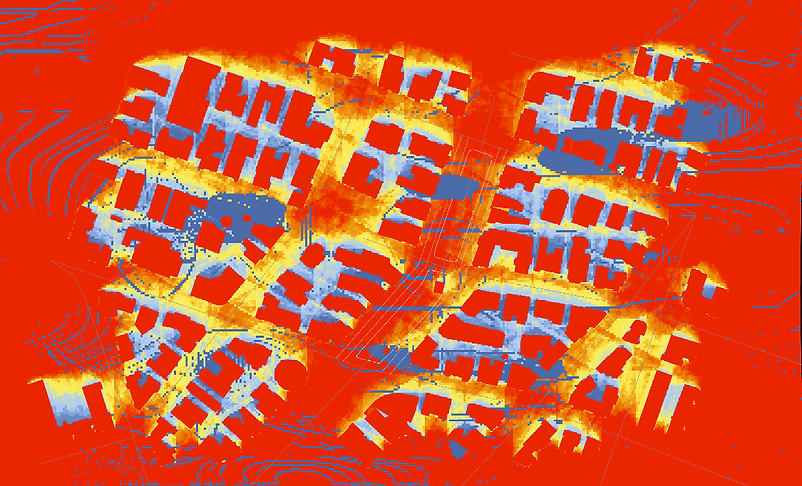
454.00<
421.64
839.29
356.93
324.57
292.21
259.86
227.50
195.14
162.79
130.43
98.07
63.1
33.36
<1.00
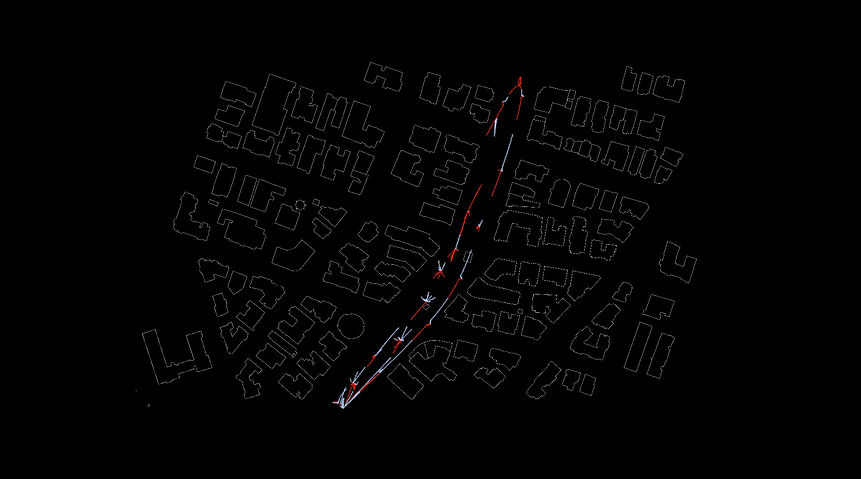
Forces moving over the area where the radiation area is lowest (eastern side). Classification of forces according to two types of colors: blue, lower radiation level. Red, higher radiation level. This way the radiation levels can be estimated in the more optimal area for stay and thus create further optimization for specific spaces of "aclimate comfort"